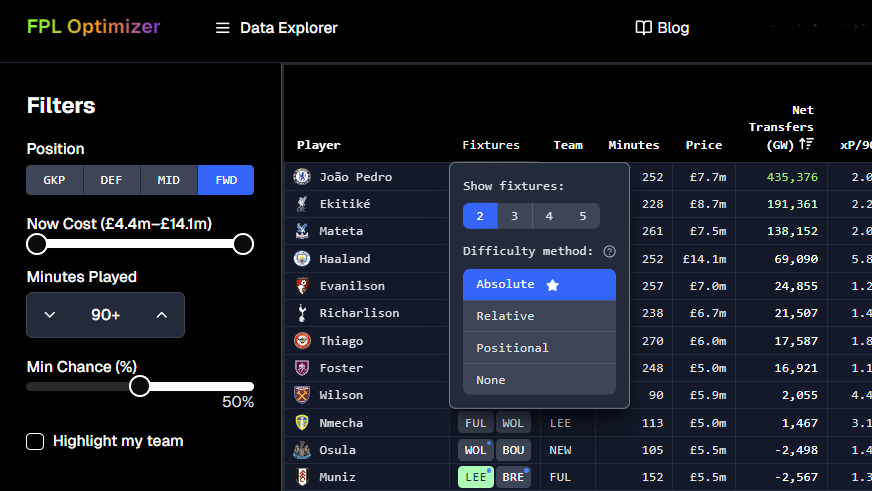
Evidence-Based Fixture Difficulty
FPL managers often use the fixture difficulty as one of the indicators for picking their squads week-to-week. Rightfully or not, it's used to decide which players to prioritize and which matchups might be worth the risk. But is the official Premier League fixture difficulty system actually good enough?
The official strength metrics aren't always clear-cut. Take Manchester City's recent performances—despite their astronomical official strength ratings, they've struggled against certain teams in ways that their numbers don't fully capture. This analysis takes an empirical look at how well the official strength measures actually predict match outcomes, and explores whether simple heuristic methods based on expected goals and goals conceded might do better.
This post follows our earlier analysis, FPL Team Strength Analysis. There, we mapped the official strength model and home/away and attack/defence patterns. Here we take a concise, evidence-based look at what “fixture difficulty” means by comparing multiple approaches (official overall and variants, plus rolling xG/xGC) and quantifying their implications for clean sheets and scoring 2+ goals.
Official FPL Strength Metrics
The official Premier League API provides several strength metrics for each team. Here's what Arsenal's data looks like from the live API:
{
  "id": 1,
  "name": "Arsenal",
  "strength": 4,
  "strength_overall_home": 1320,
  "strength_overall_away": 1325,
  "strength_attack_home": 1350,
  "strength_attack_away": 1350,
  "strength_defence_home": 1290
}
Methods Analyzed
The xG/xGC rolling metrics represent a simple attempt to create relative strength indicators by comparing a team's attacking output (expected goals) against their defensive vulnerability (expected goals conceded). This provides an alternative perspective to the official strength ratings, though the simplicity of this approach means it captures only basic performance trends.
All analysis uses data from the 2021 season onward.
Conclusion Up Front: Overall Strength Is a Strong Default
Rolling expected metrics (xG/xGC) sometimes edge out in goodness-of-fit, but the margin is modest. Official overall strength differential performs close to the best naive options and offers simplicity, consistency, and ease of interpretation—so it becomes our default.
We're resetting the default fixture difficulty to the official overall strength differential. Expected-performance style metrics (5–10 GW rolling) perform close to good enough, but simplicity and stability win for the default. Other methods will remain available for those who want choice, but this will be our recommended default for now—until we develop a better metric ourselves.

Probability of Scoring 2+ Goals by Strength Differential (Q1–Q5)
When the opponent is a similar strength (Fixture Difficulty 3), the probability of scoring 2+ goals is 47%. It drops to 30% versus a much stronger opponent and rises to 63% against a much weaker opponent.
Probability of Clean Sheet by Strength Differential (Q1–Q5)
For clean sheets: against a similar-strength opponent (FD 3) the probability is 23%. It declines to 11% versus a much stronger opponent and improves to 34% when facing a much weaker opponent.
Stats for Nerds: Logistic Regression Summaries
Overall, the official fixture difficulty metrics do a good enough job without breaking down by home/away and attack vs defence considerations—which slightly worsens predictive power. Looking at expected goals and goals conceded metrics, they sometimes outperform the official ratings, but not enough to make us switch our default approach for now.
Clean Sheet Regression Results
| Method | Pseudo R² | Coeff. | p-value |
|---|---|---|---|
| Official Overall | 0.034 | 0.0039 | 2.92e-10 |
| Official Overall (H/A) | 0.025 | 0.0030 | 5.02e-8 |
| Official (DEF vs Opponent's FWD) | 0.030 | 0.0035 | 2.62e-9 |
| xGC vs xG-Opponent (5GW) | 0.024 | 1.1347 | 8.48e-8 |
| xGC vs xG-Opponent (10GW) | 0.045★ | 1.9033 | 6.34e-13 |
Scored 2+ Goals Regression Results
| Method | Pseudo R² | Coeff. | p-value |
|---|---|---|---|
| Official Overall | 0.055★ | 0.0048 | 5.39e-19 |
| Official Overall (H/A) | 0.038 | 0.0036 | 4.32e-14 |
| Official (FWD vs Opponent's DEF) | 0.045 | 0.0041 | 2.00e-16 |
| xG vs xGC-Opponent (5GW) | 0.033 | 1.2308 | 1.79e-12 |
| xG vs xGC-Opponent (10GW) | 0.051 | 1.9317 | 3.62e-18 |
Official Strength Performance by Scoreline
Median overall strength differential by exact scoreline (home-only filter). Positive values indicate facing a weaker opponent; negatives indicate a stronger opponent. Cell captions show sample sizes.
Practical Guidance
Use “Official strength differential” as your default fixture difficulty in the app. It’s simple, robust, and performs close to more complex naive metrics.