FPL Team Strength Analysis: Home Advantage & Attack/Defence Balance
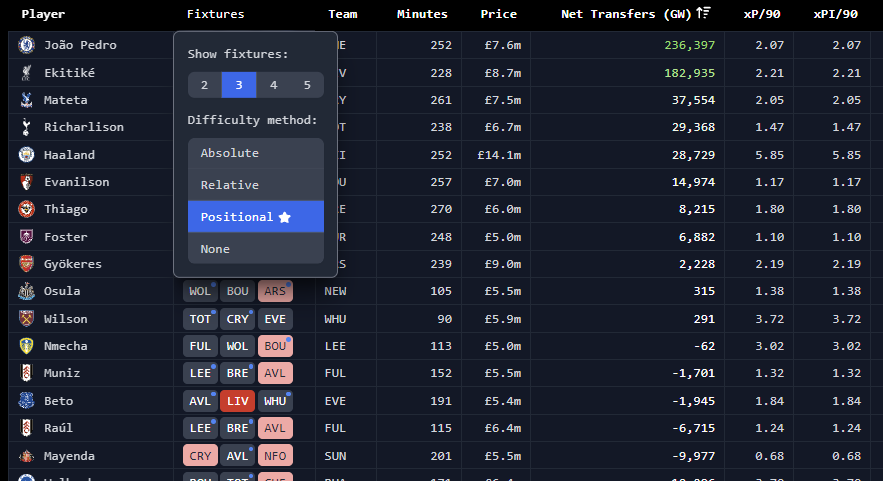
We recently introduced a new feature to display fixture difficulty in our team optimizer and other components. Deciding on the best metric was a challenge, but we've settled on a flexible approach that puts you in control.

Instead of relying on the simplistic 1-5 difficulty rating from the official FPL site, we're using their more detailed team strength data to offer several fixture difficulty perspectives. We believe this provides a more nuanced view to inform your strategic decisions.
You can now choose from four options when assessing fixture difficulty:
- Absolute: This uses the raw, unmodified strength rating of the opponent. A high number means a tough fixture, regardless of your own team's strength.
- Relative: This compares the opponent's strength to your team's strength. A match against a strong team might be 'easy' if your team is even stronger.
- Position Dependent: This is the most granular option, factoring in home and away performance. It compares your team's attack/defence strength (based on venue) against your opponent's.
- None: For the "form over fixtures" purists, you can simply turn off fixture difficulty coloring.
To understand the data powering this feature, we decided to dive deep into the official FPL team strength ratings. This analysis explores the nuances of home vs. away performance, the balance between attack and defense, and what it all means for FPL managers.
Home vs. Away Strength: A Surprising Revelation
One of the most widely accepted truths in football is the concept of "home advantage." Intuitively, we expect teams to perform better in front of their own fans. However, a deep dive into the official FPL team strength ratings reveals a startling contradiction to this belief.
The chart above visualizes each team's strength rating for home and away fixtures. Contrary to expectations, nearly every team in the league possesses a higher strength rating when playing away. This suggests that, according to the official FPL data, there is a distinct "away advantage."
Key Insights from the Data
The "Away Advantage" Effect: The data indicates that most teams are statistically stronger when playing on the road. This is most noticeable for teams like Aston Villa and Newcastle, which see a significant jump in their overall strength rating in away fixtures.
Consistent Performers: Top-tier teams like Liverpool and Arsenal maintain very high strength ratings regardless of venue, but even they are rated slightly higher away from home. Teams like Fulham and West Ham show no difference, indicating a consistent performance level in either location according to these ratings.
Attack vs. Defence: Finding the Tactical Balance
Beyond the surprising home/away data, the FPL strength ratings offer a fascinating look into team tactics. How do clubs balance their attacking ambitions with defensive stability? The data reveals distinct strategic profiles.
This visualization directly compares the attacking and defensive strength ratings for each team. While some teams show a clear preference for one over the other, the truly elite teams excel in both disciplines.
Attacking Powerhouses
Arsenal and Liverpool emerge as the league's top attacking forces, with the highest ratings for offensive strength. This reflects their ability to consistently create high-quality scoring opportunities.
Defensive Rocks
On the other side of the ball, Liverpool and Manchester City boast the most formidable defences. Their high defensive ratings indicate a disciplined structure that is difficult to break down.
A quick note on Manchester City: while their defensive strength rating is high, they have been on a surprising losing streak this season, with recent losses to Brighton and Tottenham. It's highly likely that the official FPL ratings will be updated soon to reflect this dip in form, so keep a close eye on their fixtures and performance.
The Complete Strength Landscape
To truly understand the strategic landscape, we need to view both attack and defence ratings simultaneously. The scatter plot below maps out each team's tactical identity, showing us which teams are balanced powerhouses and which have made a clear trade-off between attack and defence.
This plot provides the most comprehensive view of team profiles. By mapping each team's attacking and defensive strength, we can categorize them into four distinct tactical groups.
Next Steps: Building a Better Model
This has been a brief overview of the official FPL team strength data. As we've seen, there are some surprising inconsistencies, such as the apparent "away advantage," which suggest these ratings may not be the most accurate predictor of performance.
As a follow-on project, we plan to do a much deeper analysis of team performance data to build our own predictive strength model. The goal is to provide a more reliable and nuanced metric to showcase in our tables and tools, helping you make even better FPL decisions.
In the meantime, our tools give you the power to choose how fixture difficulty is calculated. You can select from the Absolute, Relative, or Position Dependent models based on the official data, or turn it off entirely. We believe giving you this granular control is the best approach for now.
Analysis based on official Fantasy Premier League team strength ratings. These ratings are periodically updated and can change throughout the season based on team performance and transfers.